How do arrow forecasts work?
For every single cyclone and hurricane, a forecast is supplied with an arrow and differing colors such as the one below. What do these mean?
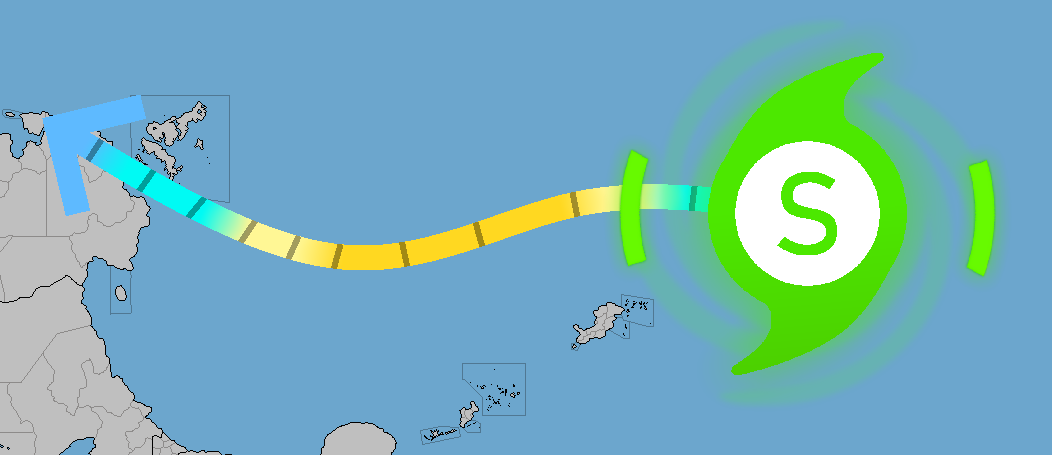
Let's go through this step-by-step, starting with the colors of this cone. The colors are determined by what category the cyclone/hurricane is expected to be on the Saffir-Simpson scale, the scale with Category 1 hurricanes through 5. A color key is below:  With this, we can determine that this storm will soon become a Category 2 hurricane on the scale. Now, what about the little black bars on the forecast arrow?
These show timing, with a new black bar being placed on the arrow every 12 hours it's expected to survive. 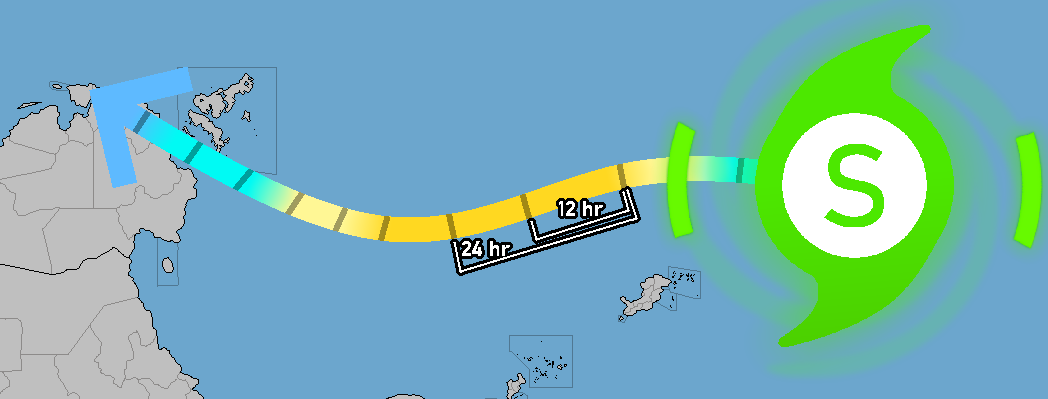 This is a graphic that shows the difference in time between some of the bars.
 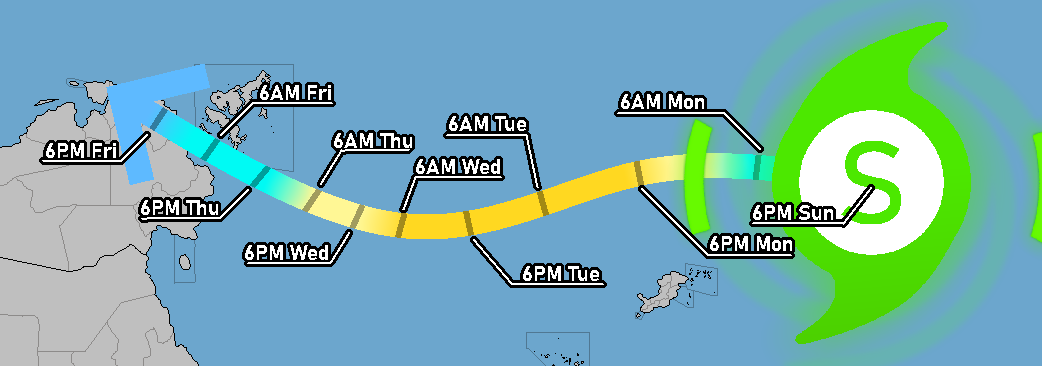 This is the forecast arrow if the timing of every bar was shown, though only the final bar's timing is shown in real outlooks. You can see how if this advisory was issued on 6PM Sunday, then the final point would be on 6PM Friday. But, if this advisory was issued on Monday, the final point would be at 6PM Saturday.